next >
Relative Performance of Block Matching Algorithms
While the data gathered from these experiments provides insight into the behaviour of individual algorithms they do not shed any light on the central concern: which algorithm is the best?
To answer this question adequately a definition of best is required. Is the best algorithm the one that produces the highest quality output? If this was the case then one could conclude from the results that the Exhaustive Search was the best for coding the Football sequence. It is clear that the exhaustive search produces the best quality output of all block matching strategies, but it requires so many matching criteria to be evaluated that it can hardly be considered the best. Is the best algorithm the one that evaluates the fewest matching criteria? A block matching algorithm that returned nothing but zero vectors could do so without considering any candidate blocks at all. The quality of the resulting frames would not be very good however and a block matching algorithm that does nothing at all can hardly be considered the best.
Clearly it is the combination of the number of criteria evaluations required to match blocks and the quality of those matches that must be used to compare the relative merits of different block matching algorithms.
Fortunately this realisation does not preclude drawing conclusions. The data gathered during the experiments can be used to answer two questions: Which algorithm provides the "cheapest" way of achieving a given quality level? and Given an amount of processing power to "spend" which algorithm "buys" the highest quality results ? The data from the comparisions of the matching algorithms when graphed approximate a curve that marks a cost-quality barrier. Algorithms close to this curve offer reasonable trade-offs between cost and quality. Those algorithms that do not are undesirable. Greedy Algorithm E for example proved to be of little use. For any level of quality it produced there was another algorithm that delivered the same level of quality more cheaply.
All the block matching algorithms tested can be compared in a similar way. It is clear from the two graphs below that the exhaustive search produces the highest quality images but requires orders of magnitude more criteria evaluations to match blocks.
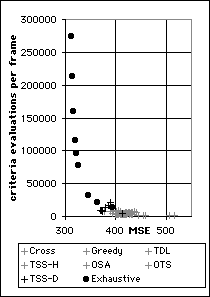
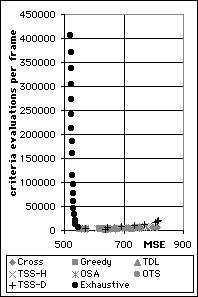
Cost-Quality Performance of Exhaustive Search and Three Step Search (Decremental) compared to all the other algorithms used to code the Football sequence (left) and the Garden sequence (right)
Examining the performance of all the algorithms except the exhaustive search and TSS-D provides some useful insights and their performance is graphed here:
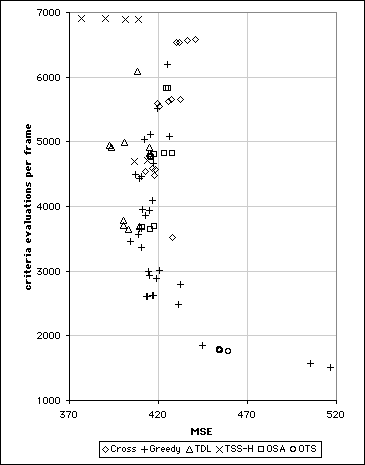
Cost-Quality Performance of algorithms used to code Football sequence.
The data collected when coding the Football sequence approximate a curve. Excluding exhaustive search and TSS-D, the Three Step Search achieved the highest quality images (MSE close to 370) but at a relatively high cost. The 2-D Logarithmic (TDL) search was the most efficient search algorithm for generating images with slightly higher MSE values but below 400. For generating images sequences with MSE values above 400 the Greedy Algorithms were most efficient. For simplicity the graph does not show the Greedy Algorithms individually but the graphs elsewhere can be used to determine which data points represent which algorithms. It must be said however that no single Greedy Algorithm covered the entire range. The results suggest that for MSE levels above 400 the Greedy Algorithms, with the exception of the OTS, were the most efficient. The OTS occupies what is almost a single point on the cost-quality curve yielding an MSE of 454 from 1781 matching criteria evaluations.
This graph illustrates the same data for the Garden sequence and the data are arranged very differently to the Football sequence data.
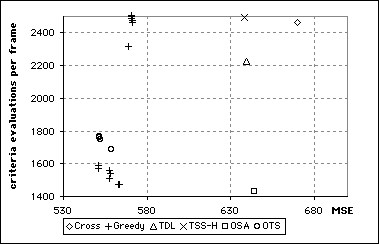
Performance of algorithms used to code Garden sequence. Not all data are shown.
When coding the Garden sequence, the Greedy Algorithms outperformed all the other algorithms, including the OTS. It is difficult to determine whether this would have been the case if there was more motion between frames. In such a case the other algorithms might have had an opportunity to operate in circumstances to which they were more suited.
The behaviour of the algorithms when coding the Tennis sequence was very similar to that of the Football sequence and the familiar cost-quality curve is clearly visible in the graph below. The TSS produced the highest quality sequences but required a large number of criteria evaluations. The quality of the sequences produced by the TSS was so close to the quality of sequences generated by the TDL and the difference in complexity so great, that the TSS does not appear to have given very good value. For image sequences with MSE values above 250 the Greedy Algorithms proved to be more successful than the OSA, TDL and TSS. Only the OTS compared favourably with the Greedy Algorithms.
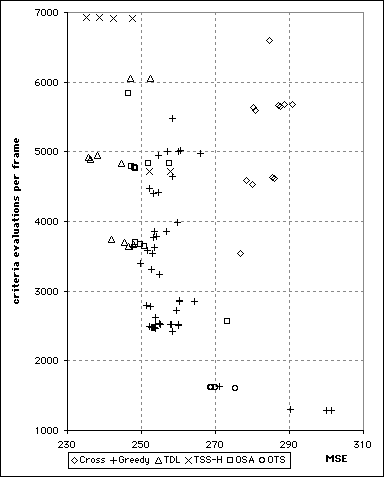
Performance of block matching algorithms used to code the Tennis sequence.
As with the other sequences, no single Greedy Algorithm outperformed the conventional algorithms. Greedy Algorithm E did not feature among the useful algorithms however. The Cross Search Algorithm (CSA) did not generate any sequences of cost and quality close to those on the edge of the cost-quality curve. When coding the Tennis sequence, the Orthogonal Search Algorithm approached the performance of the 2-D Logarithmic (TDL) search but failed to improve upon it.
[Return to
Experiments and Conclusions]
© Colin E. Manning 1996


